

You probably check your bank balance a few times a week. They know what’s in the account, but they can’t say how much of each paycheck actually stays saved. That gap between earning and keeping is your savings rate, and it tells you more about your financial direction than any single balance ever could. The good news: you can figure yours out in about two minutes with nothing more than your last pay stub and a quick look at where the money went.
Your rate doesn’t need to be perfect. It just needs to exist so you can watch it move over time. A small shift, even 1% or 2%, compounds into real money across a year. This short guide walks through the definition, the math, and a few practical ways to nudge your number upward without rearranging your whole life.
Savings rate defined, in plain English
Your savings rate is the share of your income that you don’t spend. That’s it. If you earn $5,000 in a month and save $500, your rate is 10%. The money you save can go anywhere: a high-yield savings account, a 401(k), an IRA, even extra principal on a mortgage. All of it counts.
The government tracks a national version of this number. The U.S. personal saving rate was 4.1% in August 2026[1]. That figure covers all households and uses a specific formula based on disposable personal income. It’s useful as a broad economic signal, but it’s not a grade for your household.
Your personal rate is more specific. It answers one question: out of every dollar that came in this month, how many cents stayed? Here’s a quick breakdown of what counts and what doesn’t:
| Counts as saving | Doesn’t count |
|---|---|
| 401(k) or 403(b) contributions | Minimum debt payments |
| IRA deposits | Credit card spending |
| Emergency fund transfers | Rent or mortgage (unless extra principal) |
| HSA contributions | Groceries, utilities, subscriptions |
| Extra mortgage principal | Taxes withheld |
| Brokerage account deposits | Insurance premiums |
One thing people often miss: employer 401(k) matches. If your company puts in $150 a month, that’s real saving. You can include it or exclude it. Just be consistent each time you calculate.
The two-minute calculation
You don’t need a spreadsheet or a finance degree. Grab your most recent pay stub and your bank or brokerage statements from the same period. Then follow three steps.
Step 1: Find your income
Pick a number. Gross pay (before taxes) or take-home pay (after taxes) both work. The next section explains which to choose. For now, just pick one and write it down. Example: $4,200 take-home.
Step 2: Add up what you saved
Pull together every dollar that went into savings, retirement, or investment accounts during that pay period. Include automatic 401(k) deductions, transfers to a savings account, HSA contributions, and any extra debt principal. Example: $200 to a 401(k) + $150 to a savings account + $50 to an IRA = $400 total.
Step 3: Divide and multiply
Savings divided by income, times 100. That’s your rate.
$400 ÷ $4,200 × 100 = 9.5%
That’s it. Two minutes, three steps. Write the number down somewhere you’ll see it next month. The point isn’t to judge the result. The point is to have a starting line.
If you use Amppfy, your Budget page already shows the month split into four slices: Bills, Savings, Subscriptions, and Everyday spending. Your savings slice and its month-by-month trend are right there, read from the plan you already entered.
Take-home or gross: which to use
This question comes up every time someone sits down to calculate. Both approaches are valid, but they answer slightly different questions.
| Gross income | Take-home income | |
|---|---|---|
| Includes | Pay before any deductions | Pay after taxes, benefits, 401(k) |
| Best for | Comparing to national stats or benchmarks | Seeing what share of your take-home pay you keep |
| Typical result | Lower rate (bigger denominator) | Higher rate (smaller denominator) |
| Catches | Pre-tax 401(k) shows up on both sides | Easy to forget pre-tax retirement savings |
If you use gross, remember to count pre-tax retirement contributions as saving. They’re deducted before your paycheck hits, so they’re easy to overlook. If you use take-home, add those contributions back into both the numerator and denominator. Otherwise you’ll undercount.
For most people earning a regular paycheck, take-home pay is simpler. You see the deposit in your bank account. You see what left. The difference is what you kept. No hunting for tax withholding numbers.
The one rule: pick one method and stick with it. Switching between gross and net from month to month makes your trend meaningless. Consistency matters more than precision here.
Why your own trend matters more than a benchmark
The national saving rate moves around from month to month. Those swings reflect millions of households with wildly different incomes, costs, and goals. Your situation isn’t average, and your target shouldn’t be either.
A single parent with $52,000 in income and $1,400 in rent faces a completely different equation than a dual-income couple splitting a $1,800 mortgage. Comparing either household to a national average tells you almost nothing useful.
What does tell you something: your own number over three, six, or twelve months. Here’s what a personal trend reveals that a snapshot can’t:
- Whether a raise actually changed your saving or just your spending
- Seasonal patterns, like higher utility bills in summer or holiday spending in December
- The real impact of canceling a subscription or refinancing a loan
- Whether an automatic transfer is sticking or getting overridden
Think of it like stepping on a scale. One reading is noise. A line on a graph is a signal. If your rate was 6% in January and 8% in June, you’re moving in the right direction regardless of what the national number does.
Building a household budget from your existing plan makes this tracking almost automatic. You set up your bills, your savings goals, and your payday once. Then you watch the trend instead of rebuilding the math each month.
Raising it a little at a time
Big jumps rarely last. Telling yourself you’ll save 20% starting next month usually ends the same way a crash diet does: three good weeks, then a rebound. Small, steady increases stick.
The 1% method
Pick your current rate. Add 1% of your take-home pay to your savings transfer. If you bring home $4,000 and currently save $320 (8%), bump the transfer to $360 (9%). That’s $40 a month, about $1.33 a day. Do it again in two or three months. Over a year, you could move from 8% to 11% without feeling a squeeze.
Automate the timing
Set your savings transfer to hit the same day as your direct deposit. Money you never see in your checking account is money you don’t miss. Under the SECURE Act 2.0, new employer retirement plans must automatically enroll employees at a starting rate between 3% and 10%[2]. That same principle works for personal transfers: default to saving, then spend what’s left.
Use windfalls wisely
Tax refunds, bonuses, and side-gig income don’t feel like “your money” the same way a regular paycheck does. That mental gap is an opportunity. Route half of any windfall straight to savings. You still get to enjoy the other half, and your rate gets a one-time boost without touching your daily routine.
Trim one recurring cost
Cancel one subscription you forgot about. Switch to a cheaper phone plan. Negotiate your car insurance. Redirect the difference to savings. Even $15 a month adds $180 a year. It won’t change your life overnight, but it moves the line on your trend chart.
Here’s a quick look at how small rate increases add up on a $50,000 take-home salary:
| Rate | Monthly saving | Annual saving |
|---|---|---|
| 5% | $208 | $2,500 |
| 8% | $333 | $4,000 |
| 10% | $417 | $5,000 |
| 12% | $500 | $6,000 |
| 15% | $625 | $7,500 |
The jump from 5% to 10% is $208 a month. That’s real, but it’s also just $6.85 a day. Framing it that way can make the goal feel less abstract.
Frequently asked questions
Should I include employer 401(k) matches in my savings rate?
You can, and many financial planners do. An employer match is money saved on your behalf, so it reflects your total saving picture. Just be consistent. If you include it one month, include it every month. The match won’t show up in your bank account, but it absolutely grows your net worth.
What’s a good savings rate to aim for?
There’s no universal right answer. A rate that lets you build an emergency fund, contribute to retirement, and make progress on your goals is a good rate for you. If you’re starting at 3%, getting to 6% is a meaningful win. If you’re at 12%, pushing to 15% might make sense depending on your timeline. Focus on your trend, not a magic number.
Does paying off debt count as saving?
Minimum payments don’t. Extra principal payments do, because they increase your net worth the same way a savings deposit does. If you put an extra $200 toward your student loans beyond the minimum, that $200 counts. You’re choosing to build equity instead of spending.
How often should I recalculate?
Once a month is plenty. More than that and you’re reacting to noise rather than spotting a trend. Pick a day, maybe the first Saturday after payday, and spend two minutes running the numbers. Write it down. After three months, you’ll start to see a pattern that actually means something.
Your next two minutes
Knowing your rate is the first step. Watching it change is where the progress happens. Grab your last pay stub, add up what you saved, and divide. Write the number down. Do it again next month. That simple habit gives you a number you can actually work with.
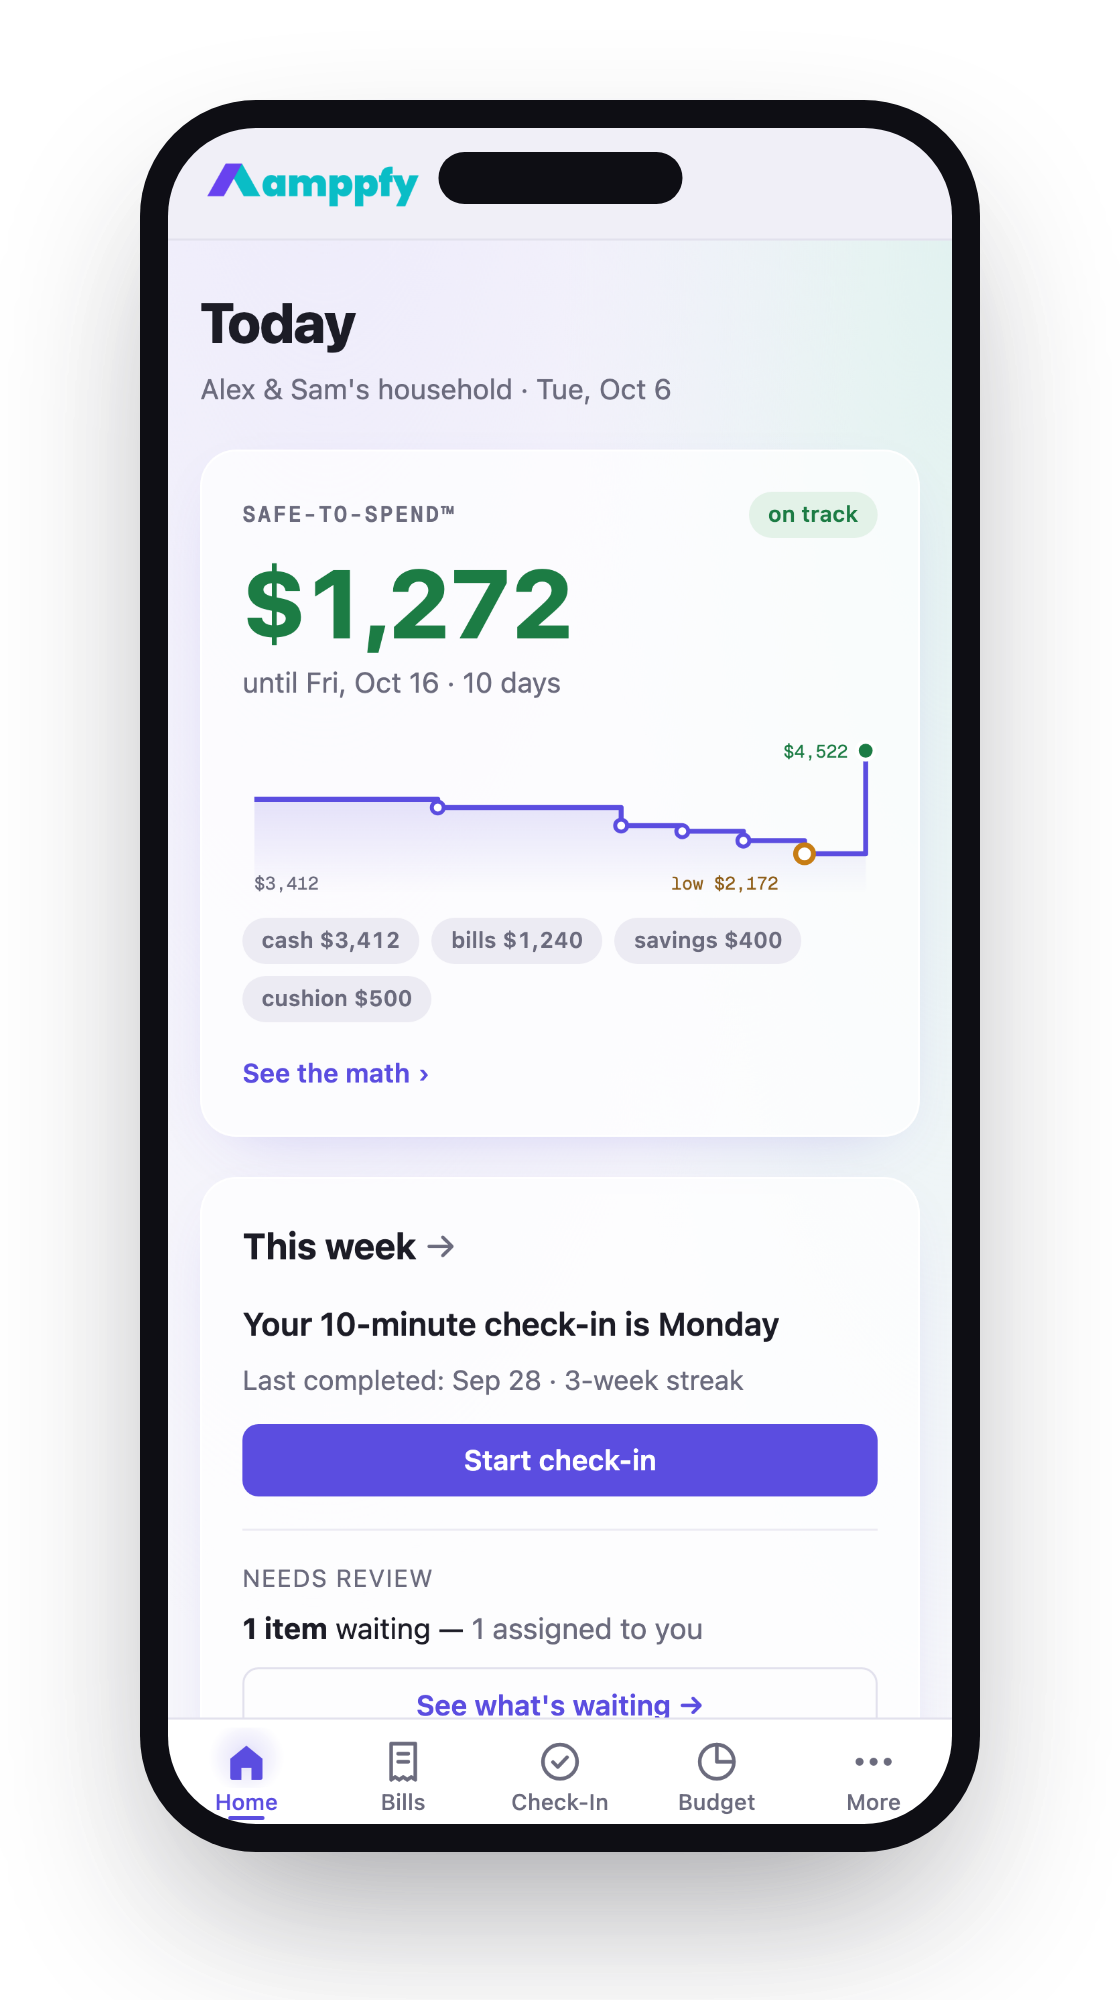
If you want the math done for you each month, get Amppfy free. Enter your balances, bills, and payday once, about ten minutes, and your Safe-to-Spend™ number is always there. Your savings show up on the Budget page, month by month, so you can watch your own trend without rebuilding a spreadsheet.