

Most people who try to save money every month eventually hit the same wall. They read about someone else’s savings rate, feel behind, and either white-knuckle a plan that doesn’t fit or give up entirely. The fix is surprisingly simple: stop measuring yourself against strangers. Your best benchmark is the person you were last month. That shift changes how you read your own numbers, how you handle a bad month, and how you build momentum over time.
Comparing to Other People Backfires
You’ve seen the advice. “Save 20% of your income.” “The average American saves X dollars per month.” These benchmarks feel helpful, but they quietly work against you.
The reason is psychological. Measuring yourself against people who appear to have more is consistently linked to envy and lower life satisfaction[1]. You scroll past a Reddit post about someone banking $1,500 a month, and suddenly your $200 feels pointless. That reaction isn’t a character flaw. It’s a well-documented pattern in how humans process comparison.
The numbers you’re comparing against are also misleading. Averages blend six-figure earners with people living paycheck to paycheck. Medians hide regional cost differences. A “good” savings rate in rural Ohio looks nothing like one in San Diego. You don’t share someone else’s rent, car payment, childcare costs, or medical bills. Their number tells you nothing about your situation.
There’s a second problem: when absolute benchmarks feel out of reach, people default to whatever comparison point is available[2]. That’s usually a friend, a sibling, or a stranger on social media. None of those people have your bills or your paycheck schedule.
A better comparison point exists, and you already have all the data. It’s your own last month.
Your Own Last Month as the Benchmark
Your last month’s savings number is the most honest yardstick you have. Same income. Same rent. Same insurance premiums. The only things that changed are your choices and your circumstances, and both of those are worth examining.
How to Set the Baseline
Pick a single number: how much did your total cash and savings balances grow (or shrink) from the first of last month to the first of this month? That’s your baseline. Don’t overthink categories. Don’t separate “emergency fund” from “vacation fund.” Just look at the net change.
Here’s a worked example:
| March 1 | April 1 | Change | |
|---|---|---|---|
| Checking | $2,800 | $2,650 | -$150 |
| Savings | $4,200 | $4,550 | +$350 |
| Total | $7,000 | $7,200 | +$200 |
Your baseline is +$200. That’s the number to beat, not some stranger’s $1,500.
Why “Beat Last Month” Works
This approach taps into something researchers call self-efficacy: your belief that your own actions produce results. Self-evaluation and self-efficacy are primary drivers of financial well-being[3], more than income level or financial literacy scores. When you see your own number move from +$200 to +$275, you built that. It’s evidence that your decisions matter.
You don’t need a complicated system to track this. Amppfy’s Budget page shows the month as four slices: Bills, Savings, Subscriptions, and Everyday spending. Your savings total appears month by month, pulled from the plan you already entered. One glance tells you whether this month moved the needle compared to last month.
What a Month-by-Month View Shows You
A single month’s number is useful. A string of months is revealing. Patterns emerge that you’d never spot from a yearly total or a snapshot.
Seasonal Spending Patterns
Three months of data will show you which months are naturally expensive. December is obvious. But you might notice that September costs more because of back-to-school supplies, annual subscriptions renewing, or your car insurance premium cycling. Once you see the pattern, you can plan for it instead of being surprised.
Income Variability
Your paycheck might be steady, but your actual take-home often isn’t. For hourly workers, take-home pay fluctuates in 7 out of every 10 months[4], with a quarter of those months swinging by 21% or more. Even salaried workers see variation from bonuses, overtime, or side income. A month-by-month view separates income dips from spending spikes so you know which lever to pull.
Progress You Can Feel
Here’s a simple table showing what six months of tracking might look like:
| Month | Net Savings Change | Running Total |
|---|---|---|
| January | +$150 | $150 |
| February | +$200 | $350 |
| March | -$80 | $270 |
| April | +$250 | $520 |
| May | +$300 | $820 |
| June | +$175 | $995 |
March was a dip. But the trend is clear. You’re building something. That running total is more motivating than any percentage target from a personal finance blog.
Low Months Happen: Read Them Plainly
A month where you saved nothing, or even went backward, is not a failure. It’s data. The question isn’t “what’s wrong with me?” It’s “what happened, and is it likely to happen again?”
Three Questions for a Low Month
- Was there an unusual expense? A car repair, a medical bill, a family trip. One-time costs don’t reflect your habits.
- Did your income drop? A short pay period, a missed shift, or a delayed reimbursement. This is a timing issue, not a spending issue.
- Did everyday spending creep up? More takeout, more impulse buys, more “I deserve this” moments. This is the only category where a change in behavior helps next month.
Most low months come from the first two categories. They’re events, not patterns. Read them plainly and move on.
The Liquid Buffer Reality
A useful frame: middle-income households typically need about $4,800 in liquid cash to handle normal monthly fluctuations, yet the median household holds only $3,000. If you’re below that buffer, a low month isn’t surprising. It’s expected. Your job isn’t to never have a low month. It’s to have fewer of them over time.
When you’re building a household budget from your existing plan, low months become part of the forecast rather than a shock. You account for the car registration in March and the holiday gifts in December. The plan absorbs the hit before it lands.
Counting the Months You Saved, Not the Streak
Streak-based thinking is fragile. Save for four months straight, miss one, and it feels like starting over. That’s not how money works. Your savings account doesn’t reset to zero because you had a rough February.
Count the wins instead. Out of the last 12 months, how many ended with a positive savings change? Seven out of twelve is solid. Nine out of twelve is excellent. The number of positive months matters far more than whether they were consecutive.
This reframe does two things:
- It removes the pressure of perfection. You don’t need an unbroken streak. You need a winning record.
- It highlights your actual ratio. If you’re saving in 8 out of 12 months, you’re building wealth. Period.
Here’s what different ratios look like over a year, assuming an average of $200 saved in positive months:
| Positive Months | Estimated Annual Savings |
|---|---|
| 6 out of 12 | ~$1,200 |
| 8 out of 12 | ~$1,600 |
| 10 out of 12 | ~$2,000 |
Even 6 out of 12 puts you ahead of where you started. The goal is to nudge that ratio up by one or two months each year, not to achieve a flawless record.
Research backs this up. People who maintain a consistent saving habit, even a small one, are significantly better prepared to handle financial shocks than those who save larger amounts sporadically. Frequency beats intensity.
Frequently Asked Questions
How much should I try to save each month?
Start with whatever your last month’s number was, then aim to beat it by any amount. Even $10 more is progress. Percentage targets like “save 20%” can be useful long-term goals, but they’re terrible starting points because they ignore your actual bills and obligations. Your own history is a better guide.
What if I had a month where I saved nothing?
That month still counts as data. Look at why it happened. If it was a one-time expense like a medical bill or car repair, it doesn’t say anything about your habits. If everyday spending climbed, pick one specific category to trim next month. One category, not five.
Should I count paying down debt as saving?
Yes. Reducing debt increases your net worth the same way adding to savings does. If you paid $300 toward a credit card balance beyond the minimum, that’s $300 of progress. Track it the same way you’d track a deposit into savings.
How do I track this without spending a lot of time?
You need two numbers: your total liquid balances on the first of this month and the first of last month. Subtract. That’s it. If you use Amppfy, the savings line on your Budget page already shows this month over month, so you don’t even need to do the subtraction yourself.
Your Best Benchmark Is Already in Your Back Pocket
The most reliable way to save money month after month isn’t copying someone else’s plan. It’s competing with your own recent past. Last month’s number is specific, honest, and completely within your control. Count the months you moved forward, forgive the ones you didn’t, and watch the ratio improve.
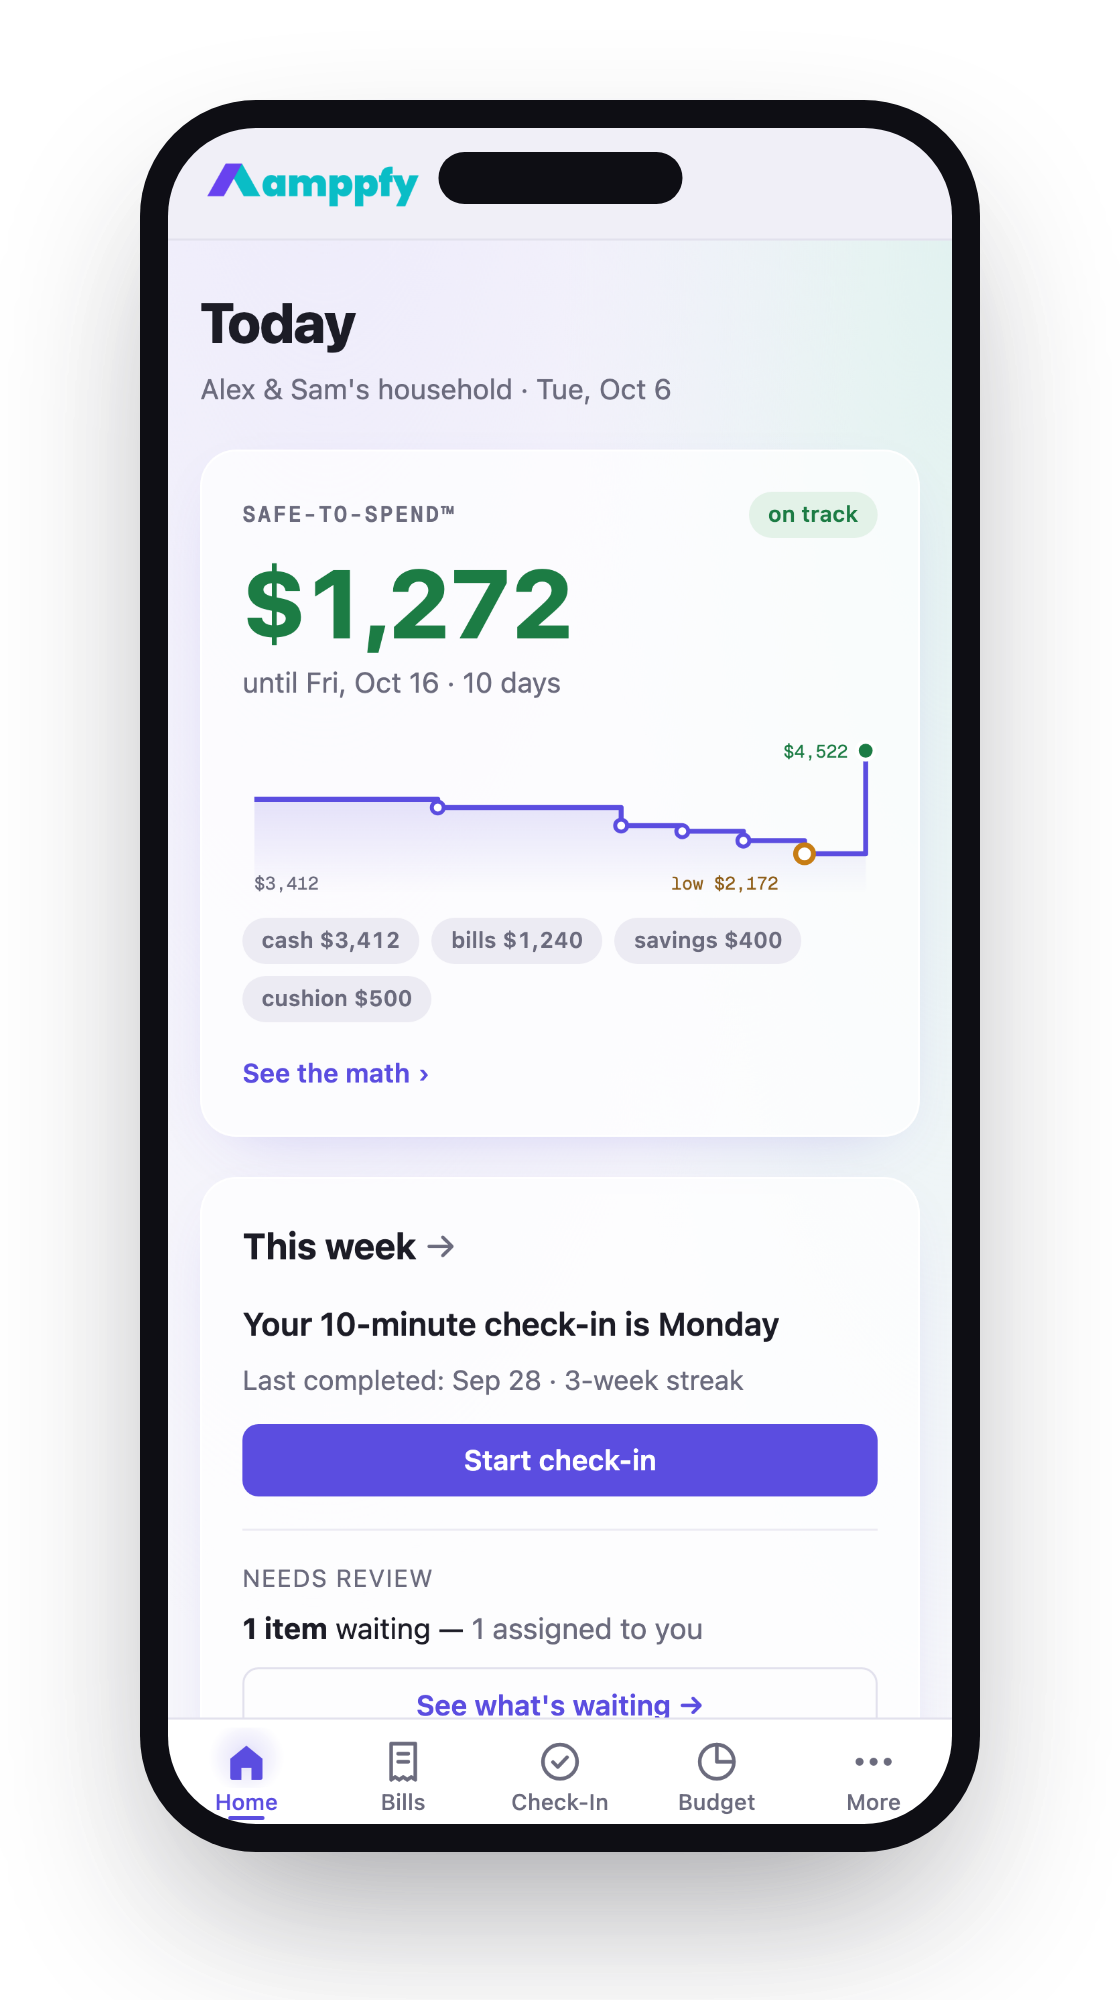
If you want one number that tells you what’s safe to spend before your next paycheck, Amppfy shows exactly that. Enter your balances, bills, and payday once: about ten minutes: and your Safe-to-Spend™ number stays current. Get Amppfy free on iPhone or the web and let your own months do the talking.