

Most people have a rough idea of where their money goes each month. Rent or mortgage takes a big chunk. Groceries eat up another slice. But when you try to pin down the full picture, the numbers get fuzzy fast. Understanding how a typical American household splits its spending can give you a useful frame of reference, not as a scorecard, but as a starting point for building your own plan. That’s the real value of studying household budget data: it shows you the shape of spending so you can decide where yours should bend.
What follows is a breakdown of the major categories, where the data comes from, why your numbers will differ, and how to use averages without letting them make you feel behind.
Where the numbers come from
The most reliable snapshot of American spending comes from the Bureau of Labor Statistics Consumer Expenditure Survey. The BLS surveys thousands of households each year, tracking what they earn and where they spend. The most recent annual release, covering 2024 and published in December 2025, puts average household income before taxes at $104,207[1]. That figure includes wages, investment income, and government transfers, so it’s higher than what many people picture as “average.”
The survey breaks spending into broad categories: housing, transportation, food, healthcare, insurance and pensions, entertainment, apparel, education, and a catch-all “other” bucket. These categories haven’t changed much in decades, which makes them useful for spotting trends over time.
A few things worth knowing about the data. The survey uses “consumer units,” which roughly means a household: a family, a single person, or any group sharing major expenses. It captures spending, not bills alone. A car payment counts. So does a parking meter. And the numbers are averages, meaning they blend a studio apartment in Topeka with a four-bedroom house in San Jose.
That blending is both the strength and the weakness. You get a bird’s-eye view of national spending patterns. You don’t get a mirror. Keep that in mind as we walk through the categories.
Housing, transportation, and food: the big three
These three categories dominate every average household budget, and it’s not close. Together they account for about 63% of total spending in the BLS data.
Housing
Housing is the single largest line item. It includes mortgage or rent payments, property taxes, insurance, utilities, maintenance, and furnishings. For the average consumer unit, housing eats about a third of total expenditures. That share has been climbing slowly for years, driven by rising home prices and rents in most metro areas.
Here’s a rough breakdown of what sits inside the housing bucket:
| Housing sub-category | Typical share of housing spending |
|---|---|
| Shelter (rent or mortgage) | ~62% |
| Utilities and fuel | ~18% |
| Household operations and supplies | ~11% |
| Furnishings and equipment | ~9% |
If your rent or mortgage alone takes more than 30% of your gross pay, that’s a fact about your market, not a verdict on you.
Transportation
Transportation is the second-largest category. It covers car payments, fuel, insurance, maintenance, public transit, and ride-hailing. The average consumer unit spends about 17% of its budget here. Households with two car payments and long commutes will blow past that number easily.
Food
Food splits into two buckets: groceries (food at home) and dining out (food away from home). Combined, food takes about 13% of spending. Your own share will run higher if you buy organic, eat out often, or feed teenagers.
Insurance, health, and the rest
Once you account for housing, transportation, and food, the remaining 37% or so of spending scatters across several categories. None of them individually rivals the big three, but together they shape your financial life just as much.
Insurance and pensions
This category captures Social Security contributions, employer-sponsored retirement plans, and personal insurance premiums (life, disability). It runs about 12.5% of spending. If you’re contributing to a 401(k) or IRA, this slice may feel invisible because it comes off the top. But it’s real money leaving your household.
Healthcare
Out-of-pocket healthcare costs, including premiums you pay yourself, copays, prescriptions, and medical services, take about 8% of spending for the average consumer unit. That share rises sharply for households with members over 55 or those on high-deductible plans.
The smaller buckets
The remaining categories round out the picture:
- Entertainment: ~5% (streaming, hobbies, sports, pets)
- Apparel and services: ~2.5%
- Education: ~2%
- Cash contributions (gifts, charity): ~3%
- Personal care, reading, tobacco, miscellaneous: ~3-4%
These smaller categories are where most people have the most flexibility. You can’t easily cut your mortgage in half, but you can adjust how much goes to dining out, subscriptions, or new clothes.
Why your split will look different
National averages describe a statistical household that doesn’t actually exist. Your spending split depends on a handful of specific factors that no survey can capture for you.
Geography
A household in Austin and a household in Buffalo face wildly different cost structures. Housing, utilities, groceries, and even car insurance vary by region. The BLS data blends all of these together. Your local reality might look nothing like the national average.
Life stage
A 28-year-old renting a one-bedroom apartment has a different budget shape than a 40-year-old with two kids and a mortgage. Childcare alone can rival a mortgage payment in high-cost areas. Student loan payments, which don’t show up neatly in the BLS categories, reshape budgets for many younger households.
Income level
Higher-income households spend a smaller share on housing and food, and a larger share on insurance, pensions, and entertainment. Lower-income households flip that ratio. The average blends everyone together, which means it may not reflect your tier at all.
Household size
Feeding two people costs less than feeding five. But some costs, like internet, a single car, or a streaming subscription, don’t scale with household size. A couple without kids and a family of four will split their budget very differently even at the same income.
The point isn’t that averages are useless. They give you a map. But your route will have its own turns.
Using averages without comparing yourself
Averages work best as a diagnostic tool, not a report card. Here’s how to use them without spiraling into comparison.
Start by listing your own spending in the same broad categories the BLS uses. You don’t need exact numbers. Rough monthly estimates work. Then set your percentages, not your dollar amounts, next to the national shares as context, not a target. If 40% of your spending goes to housing when the BLS average is about 33%, that’s not a failure. It’s information. It tells you other categories have to compress, and you can decide which ones.
A simple way to see where you stand:
- Write down your monthly take-home pay.
- List your spending in five buckets: housing, transportation, food, savings, and everything else.
- Calculate each bucket as a share of your take-home.
- Notice which buckets feel tight and which have room.
That’s the whole exercise. No judgment, just math.
Amppfy’s Budget page shows the month in four slices: Bills, Savings, Subscriptions, and Everyday spending, along with your savings progress month by month. It reads from the plan you’ve already entered, so there’s no extra work. If you want to see how your household budget stacks up against the shape described here, that view makes it quick.
The real question isn’t whether you match the average. It’s whether your split supports the life you’re building. If 20% of your income goes to transportation because you live rurally and drive 80 miles a day, that’s a fact of your life, not a problem to fix. But if 20% goes to dining out and you’re struggling to save, that’s a place to adjust.
One useful reframe: think of your budget as four walls. Housing, food, utilities, and transportation are the walls. Everything else is furniture. You arrange the furniture however you like, as long as the walls stand.
Frequently asked questions
What’s a good percentage to spend on housing?
There’s no single right number. The BLS data shows housing averaging about 33% of total spending. If you’re above that, look at whether other categories have enough room for savings and essentials. The percentage matters less than whether the whole plan works together.
How much should I budget for groceries each month?
In the BLS data, food is about 13% of total spending, split between groceries and dining out. Start from what you actually spent last month, keep dining out as its own line, and adjust for dietary needs and local prices.
Should I budget based on gross or net income?
Net income (take-home pay) is more practical for monthly budgeting because it reflects the money you actually control. Gross income matters for ratios like housing-to-income that lenders use, but your day-to-day plan should work from what hits your bank account.
How often should I review my budget?
A weekly check-in of about ten minutes keeps things current without turning budgeting into a chore. That’s enough time to update account balances, confirm upcoming bills, and make sure your Safe-to-Spend™ number still looks right. Monthly deep reviews help you spot trends and adjust your plan for the next month.
Your budget, your shape
National spending data gives you a frame, not a cage. The BLS numbers show where most American households put their money, and that’s genuinely useful for spotting blind spots in your own plan. But the best budget is the one that fits your actual life: your rent, your commute, your family size, your goals.
Pick one category this week where you suspect you’re off. Run the math. See what the number actually is. That ten-minute exercise will tell you more than any national average ever could.
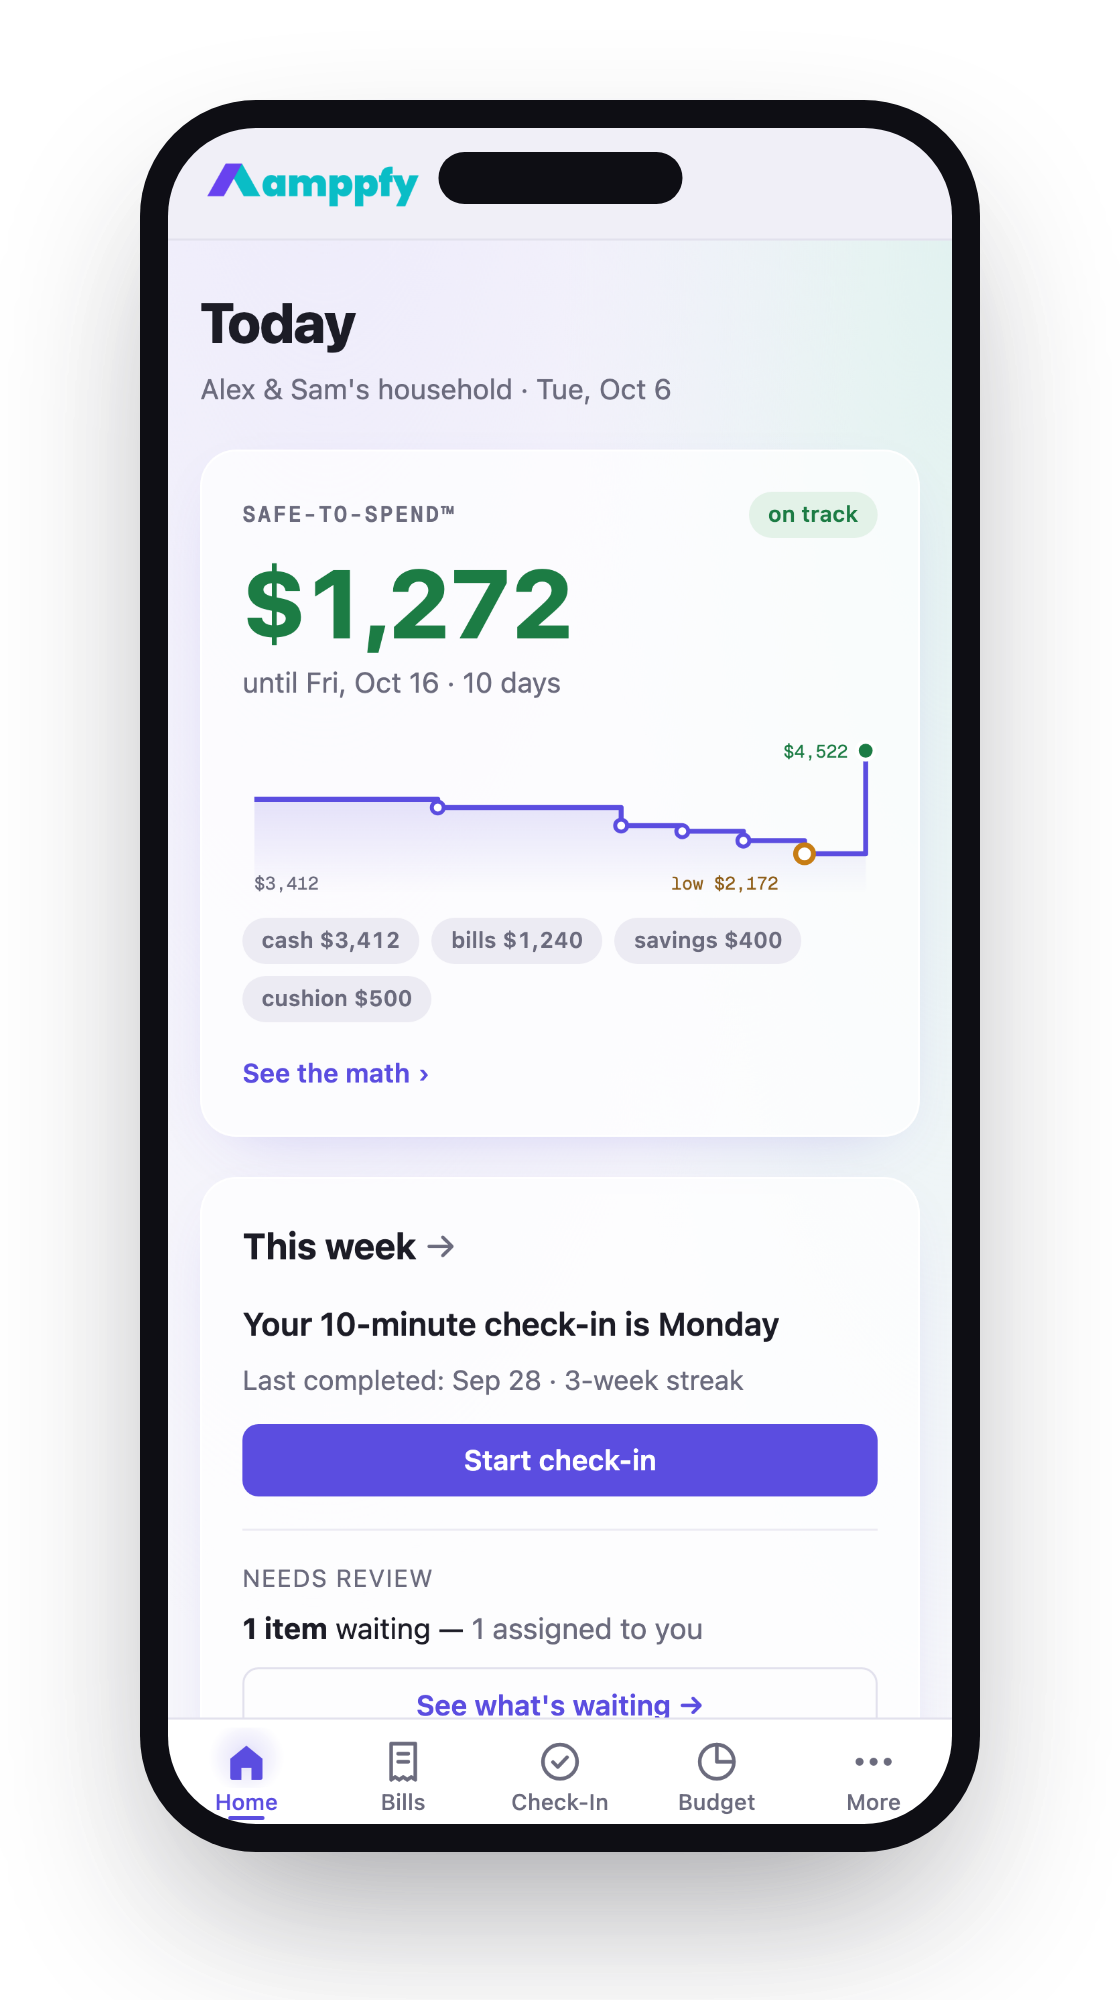
If you want a quick way to see what’s truly safe to spend before your next paycheck, get Amppfy free on iPhone or the web. Enter your balances, bills, and payday once, about ten minutes, and your Safe-to-Spend™ number is always there: $3,412 cash − $1,240 bills − $400 savings − $500 cushion = $1,272. No guessing, just one clear number.